Insurance requires confidence
Typically insurance quotes are based on pre-defined models – that have a series of data sources and variables (a great example is When Fresh that offers the ability to query a huge array of property-specific values) – and draws in data from a very large pool of public and private sources. Whilst Polaron is capable of drawing this data into our simulation and combining information to spatially contextualize and confirm these data points – as well as comparing against satellite data, and other data types in order to hone and refine the models – it is parametric insurance that we believe is the future.
Polaron has the capability to then make that data Geospatially contextualized, applying data to different transport connections and producing a graph of risks within a given journey, period of time and consider a wide array of risks. Be that terrorism for overseas travel, or the proximity of relevant healthcare, disabled access as well as larger statistical datasets and offsets.
This allows the insurance company to offer a more affordable and competitive quote – since their market intelligence is in effect spatially mapped and the policy can be more constrained – than a generic “go anywhere / do anything” model – that is forced to document more generic minutiae and becomes and increasingly homogenous and commoditized product. By creating the data layer to allow more refinement – e.g. where in the EU will you go, or to what regions – then reference known data about that area – one can product a more customized product and qualify and quantify the risk profile against the insurance policy. Additionally, Parametric insurance is designed to offer rapid response – meaning that passengers sometimes get updates ahead of the service provider – owing to deeper data integration and monitoring via the insurance company – which expedites claims and drives efficiency (e.g. one fewer plane full of passengers seeking refunds in a busy terminal check-in.)

Polaron can ingest very large volumes of data to run simulation, instantiate proposed changes and calculate what not only the saving would be – but the likely cost of that saving – in financial, experience and operational terms. This permits a lot of different options to be considered and provides a platform to measure and monitor those changes.
This can be as small as considering the risks of different areas – such as for customers with disabilities or reduced mobility (NB – EU / USA has an aging population) and product contextually relevant policies with reasonable conditions that are both more accommodating and customized to the user – as well as offering a more cost-effective policy to underwrite for the insurer. With an abundance of qualifiable data – it is, therefore, easy to map this and produce an accurate model of an E2E itinerary and risk profile – and even adapt that based on patterns of behavior. Like so much – the exchange being a cheaper service for data – whilst operating inside of the current legislation.
Accountability
Most contemporary insurance legislation requires a justification or ability to articulate and demonstrate how a risk evaluation or actuarial or health assessment impacted the cost of a premium. Famously one method is to offer a prohibitive quote – however increasingly with the adoption of AI and ML into these analyses – explainable AI and processes are a requirement – since bias from training data; be it historic, ethnographic or gender-based – presents a significant challenge. To that end Polaron allows for the export of the data and “caching” of specific profiles – which alongside our proprietary DB systems allow for an E2E reproduction of results for insurance to be performed – since the model, data, and profile can be re-run and evaluated. Storing this can be done locally – else we have been asked to consider interoperability with cheap long-term storage – since the percentage of requests is minimal but still required – therefore such actions can be retrieved at a lower cost to justify a policy decision. With more and more insurance and data services being outsourced or operated by third parties – such measures are essential to provide the necessary level of accountability in these systems – and indeed in Polaron.
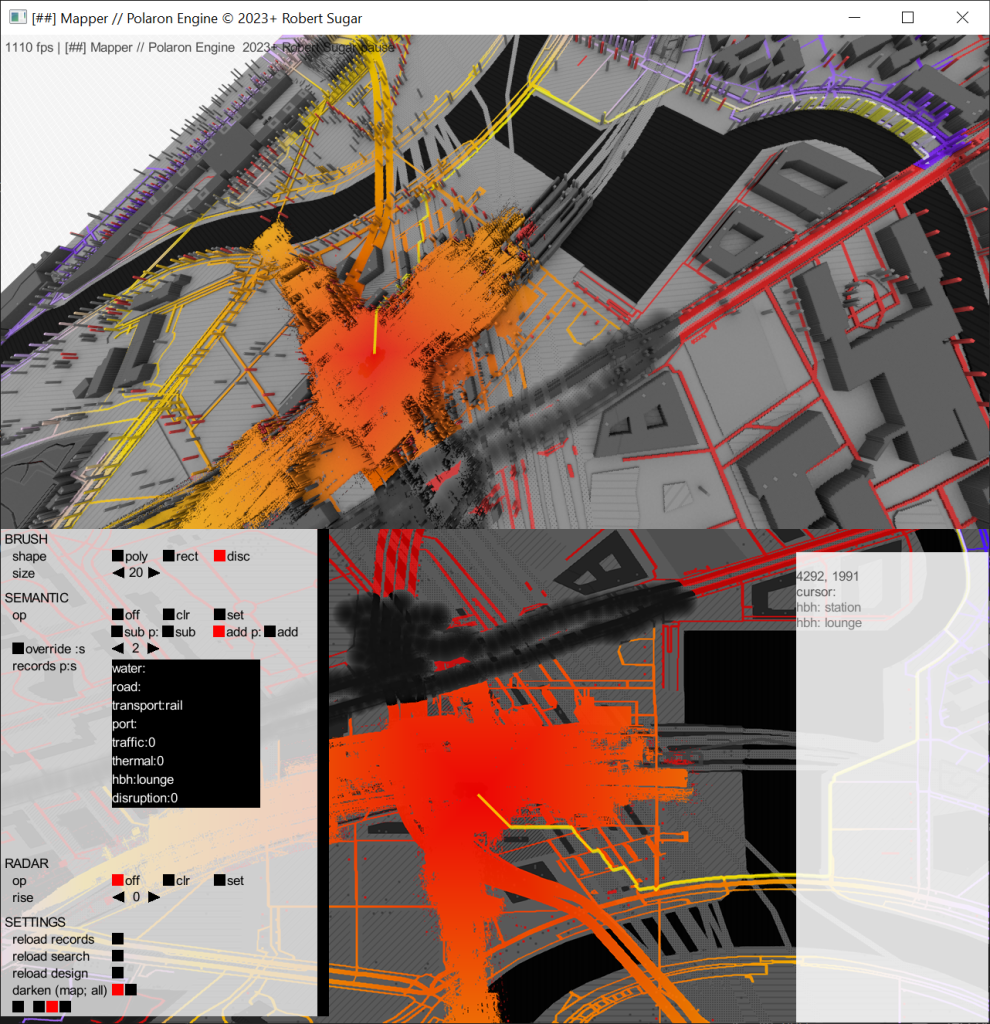
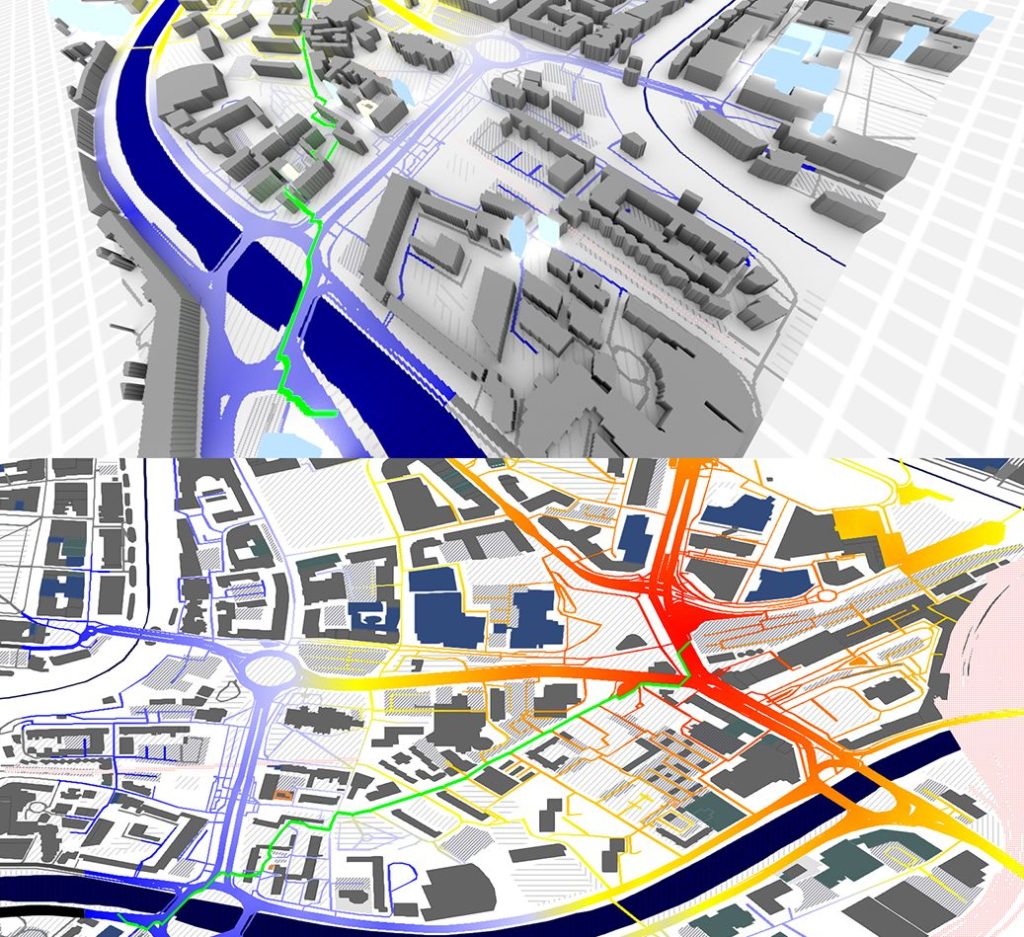
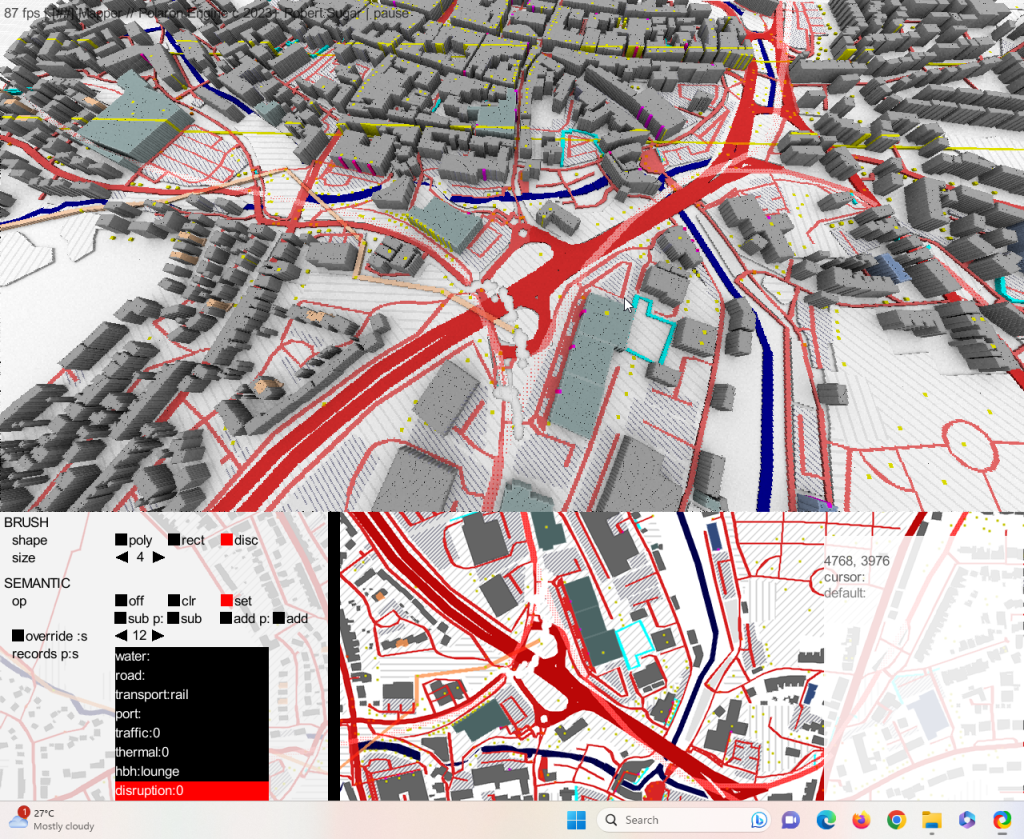
Cost, demand, and heat map modeling
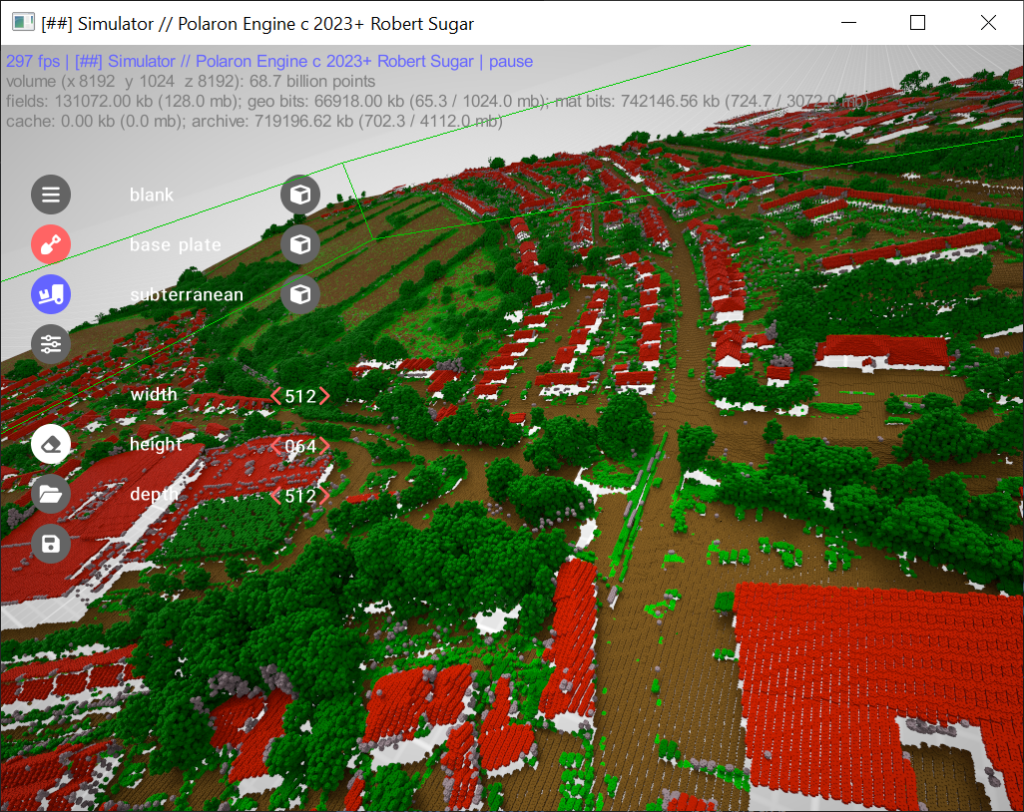
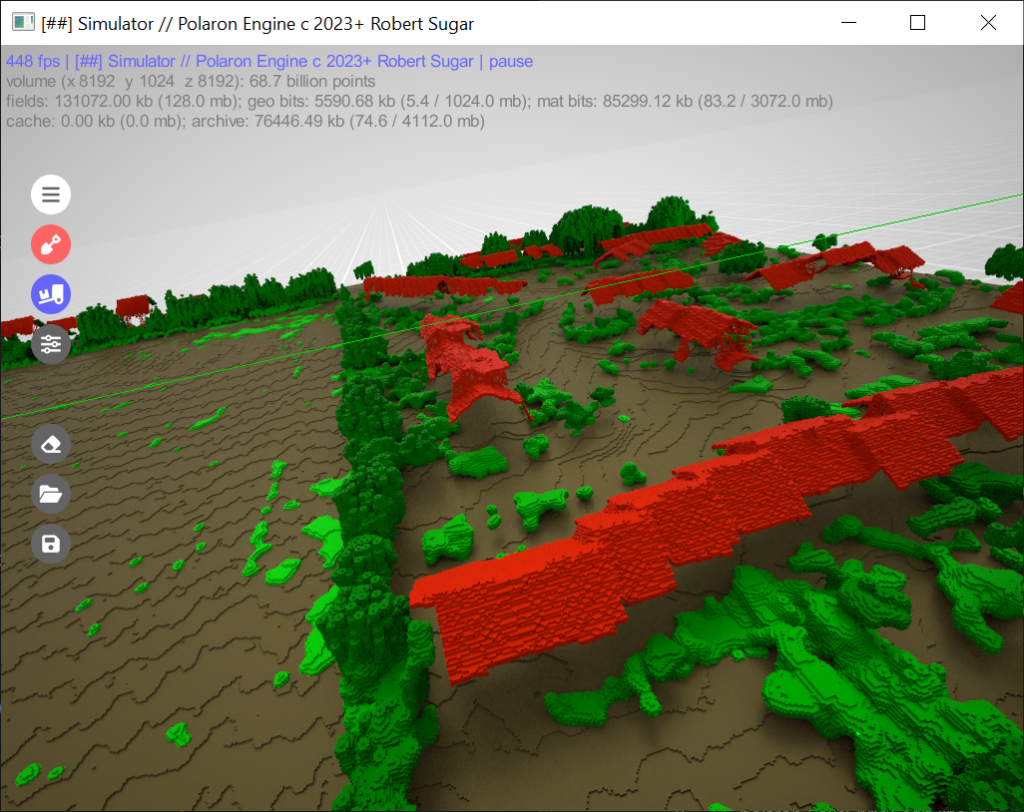
Polaron uses a proprietary means of propagation to develop and refine cost maps, and visualize and articulate geospatially encoded locations that drive demand or act as choke points for other systems. In addition to sensor-driven input – users can paint in data – such as an event area, or heightened risk – which may not have a geo-tagged reference but may be described (e.g. Central London vs Greater London vs City of London vs Greenwich). This allows social sentiment analysis and other tools to detect events and have the location and effects mapped and modeled. While sensors and APIs are optimal – it is often a case that unforeseen events / black swan events are unpredictable but must quickly be factored into the models. Providing the tools to paint in data – and observe the effect – be it negative or positive – allows for a quick response and predictive cost modeling for both the end consumers and insurance company. This can be as simple as a cancelled event, weather causing delays or as significant as natural disasters and the increasing impact of fire and heat waves – all of which cause an impact on the insurance product and its risk profile for underwriting and consequent cost to the consumer.
Blending data and providing it into a 3D format – allows for more intuitive and comprehensive analysis – as well as offering the end users something tangible – than can be served to them via a simple web browser.
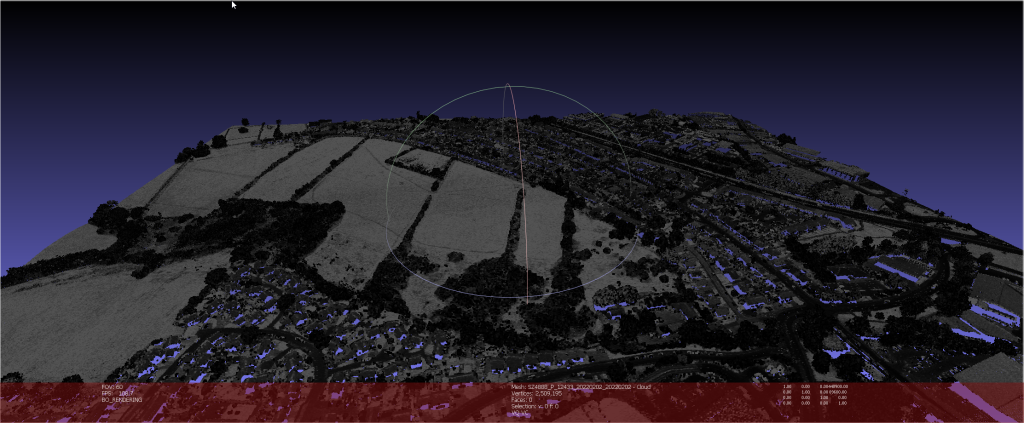
Up to date 3D models permit relevant modeling
The world changes – and so too do the maps that represent them. We can append and update our maps to be up-to-date and generate map and 3D data from them. For key sites – by empowering insurers to connect with embedded sensors and data – predictive and real-time updates, such as a delay at a station or overcrowding, can permit a virtuous circle and inform and enforce contractual and service level agreements. Which all has a significant financial impact – since the measure of the risk is significant. Additionally, many countries are considering policy to enforce liability for public safety and security onto large privately-owned but highly trafficked sites – such as shopping centers, airports, and event venues. Coupled with increasing risks and limited resources – simulation and real-time risk evaluation are met with simulation – since whilst intelligent cameras are useful they don’t produce an overall model of behavior or risk – nor factor in change (as simple as securing an exit, as complex as where to put road traffic bollards.)
API gateways and Mobile Access
Polaron works best when tied into other systems and networks – it’s, therefore, part of our larger efforts to produce an API portal with a simple and easy-to-use user interface as well as supporting mobile scanning – to permit interoperability with other systems and engage a larger audience of staff, sensors, and even the public to add and help map the environment – be that the basic sensors on a phone – through to emissions monitoring and even pulling in thermal data from LEO to build a picture of the cause and effect and changes that can be made – as well as driving certain behaviors and producing the intelligence to alter customer and commercial behaviors and in some cases to help drive decarbonization and NetZero efforts, another consideration for future insurance and underwriting as infrastructure and changes in patterns of behavior en masse – drive hard to predict spikes in visitation or demand – stressing resources, and response and potentially affecting insurance policy compliance. Finally, we are exploring how to allow users to scan environments and provide feedback – permitting both up-to-date models, reporting and a means to document a claim or incident in a geospatially signed manner.
Key technologies driving infrastructure modeling and automation of monitoring
- Accountability & Probity: Manage, document and save and archive your models and data layers to allow retrospective justification of calculations.
- Data Caching: Not all insurance needs to be live, mine simulations and feed data points to existing models and risk calculations.
- Works where you work: By allowing browser-based access for multiple users, you can work where you work (WFH!) and model on the go.
- Top performance: Our Web Stack offers cutting edge performance offering both P2P and federated connections for data & interfaces.
- High security: A secure container lets Polaron run securely inside your network or run it as an external or edge-based service.
- Connect to external services: Direct connect or Tunnel into external datastores & services via Web Tech & REST APIs and edge-based sensors.